Vectorizing Maps and Diagrams: Geographic & Technical Illustration
Convert maps, flowcharts, and technical diagrams to scalable vector format. Essential for presentations, publications, and professional documentation.
Graphics & Design Experts
Our team of experienced designers and developers specializes in vector graphics, image conversion, and digital design optimization. With over 10 years of combined experience in graphic design and web development.
Key Takeaways
- Floor plans, city maps, flowcharts, org charts, and infographics each demand a distinct vectorization strategy
- Simplify complex maps before tracing to avoid bloated SVGs with thousands of unnecessary anchor points
- Auto-tracing destroys text labels — always recreate type manually with real fonts
- Interactive SVG maps with hover states and click events turn static illustrations into powerful web tools
- Accessible SVG structure with ARIA attributes serves every user, including those on assistive technology
Every map tells a story. Every diagram encodes a decision. When these information-dense graphics are locked in raster formats, that story degrades each time you scale, reprint, or repurpose it. Vectorization is the cartographer's answer: convert fixed pixel grids into clean mathematical paths that hold their precision from a phone screen to a conference wall.
---
Why Vectorize Maps and Diagrams?
Raster maps are fragile. Zoom into a city map exported as PNG and you see aliased edges, blurred labels, and color banding. A flowchart screenshot looks fine at 100% but print it on A1 paper and every pixel screams.
Vector format solves this structurally:
If your workflow involves maps or diagrams, vectorization isn't optional — it's infrastructure. VectoSolve makes that conversion fast and AI-driven.
---
Types of Maps and Diagrams Worth Vectorizing
Geographic and Location Maps
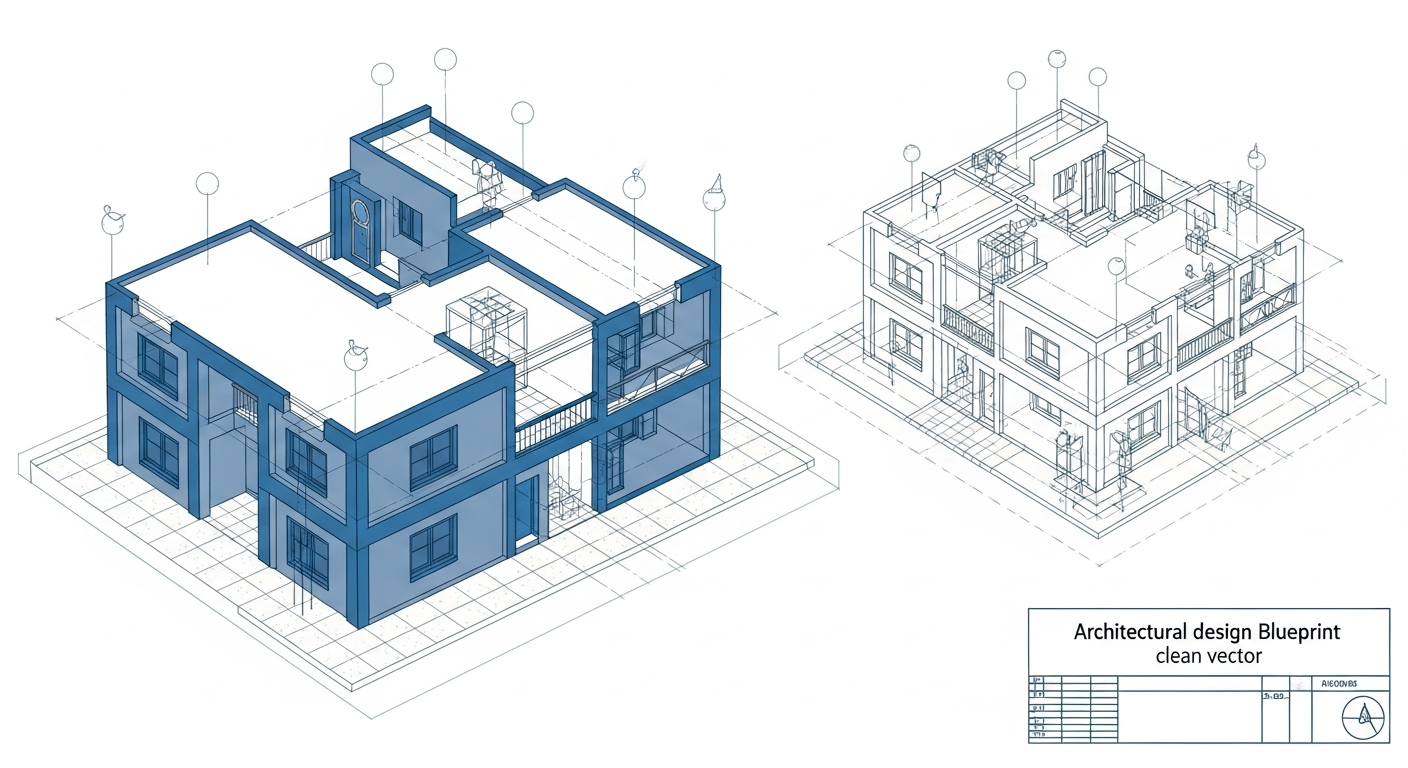
City maps, transit diagrams, campus wayfinding maps, and custom illustrated maps. Their geometry — roads, boundaries, routes — translates naturally to vector paths.Floor Plans and Architectural Layouts
Walls, doors, room labels, and furniture symbols all benefit from crisp vector lines. Architects convert scanned legacy blueprints into editable formats for renovation projects regularly.
Flowcharts and Process Diagrams
Business processes, decision trees, workflows, and system architectures share a common structure: shapes connected by lines — tailor-made for vector representation.Organizational Charts
Org charts combine boxes, connectors, and text. Converting a raster org chart means you can update titles, restructure departments, and rebrand without starting over.Infographics and Data Visualizations
Pie charts, bar graphs, icon arrays, timelines, and comparison graphics trace cleanly when they rely on geometric shapes.---
Vectorization Challenges by Graphic Type
| Graphic Type | Primary Challenge | Typical Fix | |---|---|---| | City maps | Overwhelming detail creates bloated paths | Simplify source, trace major roads only | | Floor plans | Dimension lines clutter the trace | Strip annotations pre-trace, add back as text | | Transit maps | Precise 45/90-degree angles lost | Snap paths to grid post-conversion | | Flowcharts | Arrowheads distort or merge with lines | Trace shapes separately, recreate arrows manually | | Org charts | Small text becomes unreadable outlines | Delete traced text, retype with real fonts | | Infographics | Mixed content — icons, text, photos | Segment graphic, vectorize geometric parts only | | Scientific diagrams | Hatching and stippling create excessive nodes | Replace with flat fills or vector pattern swatches |
---
The Vectorization Workflow
Step 1: Assess Source Quality
Scan physical maps at 600 DPI minimum. For screenshots, capture at native resolution. From PDFs, extract at the highest raster resolution available.Step 2: Prepare the Image
Step 3: Trace with AI
Upload to VectoSolve and let the AI detect paths, shapes, and regions. It understands topology — closed shapes are rooms, thin lines are roads, parallel lines are rail corridors.Step 4: Post-Process
Open in VectoSolve's SVG Editor for cleanup: separate elements into layers, snap paths to grid, simplify curves, and replace text outlines with live type.
---
Interactive SVG Maps for the Web
SVG elements live in the DOM, so every path and shape can respond to user events. A static PNG floor plan becomes a clickable, hoverable interface:
This pattern scales to city maps with clickable districts, transit maps with route highlighting, and org charts that expand on click.
---
Accessibility for SVG Diagrams
A vector map only sighted users can navigate is half-finished. Accessible SVGs require deliberate structure:
</code> and <code class="bg-gray-100 dark:bg-gray-800 px-1.5 py-0.5 rounded text-sm text-[#1cb721] font-mono"><desc></code> elements inside the <code class="bg-gray-100 dark:bg-gray-800 px-1.5 py-0.5 rounded text-sm text-[#1cb721] font-mono"><svg></code></li>
<li class="ml-6 text-gray-700 dark:text-gray-300 list-disc">Apply <code class="bg-gray-100 dark:bg-gray-800 px-1.5 py-0.5 rounded text-sm text-[#1cb721] font-mono">role="img"</code> and <code class="bg-gray-100 dark:bg-gray-800 px-1.5 py-0.5 rounded text-sm text-[#1cb721] font-mono">aria-labelledby</code> to the root element</li>
<li class="ml-6 text-gray-700 dark:text-gray-300 list-disc">Ensure keyboard navigation with <code class="bg-gray-100 dark:bg-gray-800 px-1.5 py-0.5 rounded text-sm text-[#1cb721] font-mono">tabindex</code> on interactive regions</li>
<li class="ml-6 text-gray-700 dark:text-gray-300 list-disc">Provide a text alternative — a table of regions or written description</li></p><p class="text-gray-700 dark:text-gray-300 mb-4 leading-relaxed text-base md:text-lg">
    <div class="my-6 rounded-lg overflow-hidden">
      <div class="bg-gray-800 px-4 py-2 text-xs text-gray-400 font-mono">html</div>
      <pre class="bg-gray-900 p-4 overflow-x-auto"><code class="text-sm text-gray-100 font-mono"><svg role="img" aria-labelledby="map-title map-desc" viewBox="0 0 800 600">
  <title id="map-title">Office Floor Plan
  Interactive floor plan showing Conference Room,
    Open Office, Kitchen, and Server Room.
"The purpose of visualization is insight, not pictures. Every vector path should earn its place by making information clearer — that is the essence of data storytelling.
---
Use Cases Across Industries
| Use Case | Format | Why Vector Wins | |---|---|---| | Presentations | SVG / EMF | Scales to any projector resolution | | Academic publications | EPS / PDF | Journals require vector figures | | Websites and web apps | SVG | Interactive, responsive, accessible | | Mobile apps | SVG / PDF | Resolution-independent on every density | | Print materials | AI / PDF | Crisp at any physical size | | GIS platforms | SVG / GeoJSON | Editable base layers for cartography |
---
Layer Organization
| Layer | Contents | Notes |
|---|---|---|
| Background | Base fills, terrain | Locked during editing |
| Boundaries | Region outlines, borders | Consistent stroke weight |
| Paths / Roads | Streets, routes, rail | Organized by hierarchy |
| Shapes | Buildings, boxes, nodes | Grouped by function |
| Labels | Place names, titles | Live text only |
| Symbols | Markers, arrows, legends | Reusable
---
Start Converting Your Maps and Diagrams
Whether you're digitizing a hand-drawn floor plan, modernizing a legacy city map, or converting a flowchart screenshot into an editable asset — high-quality source, intelligent tracing, disciplined post-processing.
Upload your map or diagram to VectoSolve and get a clean SVG in seconds. Refine it in the SVG Editor to perfect layers, replace text, and prepare for print, web, or interactive deployment.
---
| Map/Diagram Type | Key Challenge | Recommended Approach | Avg. Anchor Points |
|---|---|---|---|
| City/street maps | Excessive detail, small text | Simplify before tracing, recreate labels | 5,000–50,000 |
| Floor plans | Precise measurements needed | Trace walls, re-add dimensions manually | 500–2,000 |
| Flowcharts | Text inside shapes | Trace shapes, re-type all text | 200–800 |
| Org charts | Consistent box sizing | Template-based rebuild from trace | 100–500 |
| Infographics | Mixed raster + vector elements | Trace graphics, rebuild text/data | 1,000–10,000 |