10 SVG Use Cases for Businesses
Discover how businesses use the SVG format to improve their digital presence, from visual identity to interactive applications.
Graphics & Design Experts
Our team of experienced designers and developers specializes in vector graphics, image conversion, and digital design optimization. With over 10 years of combined experience in graphic design and web development.
Key Takeaways
- SVG adoption delivers measurable ROI across marketing, engineering, and product — from 40-60% bandwidth savings to 3x faster asset production.
- Businesses using vector-first strategies report 23-35% higher brand consistency and lower maintenance costs over 3 years.
- The 10 use cases below each include business impact analysis and ROI tables to build your internal case.
- Start with your logo and core brand assets — the lowest-effort, highest-return entry point.
- Companies delaying SVG adoption risk falling behind competitors already shipping lighter, sharper digital experiences.
Why SVG Is a Strategic Business Decision
Most SVG conversations start with pixels. This one starts with profit margins.
SVG has become the format of choice for the fastest-growing digital brands. It eliminates recurring costs — asset re-creation, multi-resolution exports, bandwidth overages, cross-platform inconsistencies — while improving UX and brand perception.
If your competitors ship SVG-powered experiences and you still manage folders of @2x and @3x PNGs, you are paying more to deliver less. VectoSolve makes this transition frictionless with AI-powered raster-to-vector conversion that produces production-ready SVGs in seconds.
---
1. Brand Identity and Visual Consistency at Scale
Pixelated logos on Retina displays cost you credibility with every impression. A single SVG logo renders perfectly from a 16x16 favicon to a 20-foot conference backdrop — one file, zero quality loss.
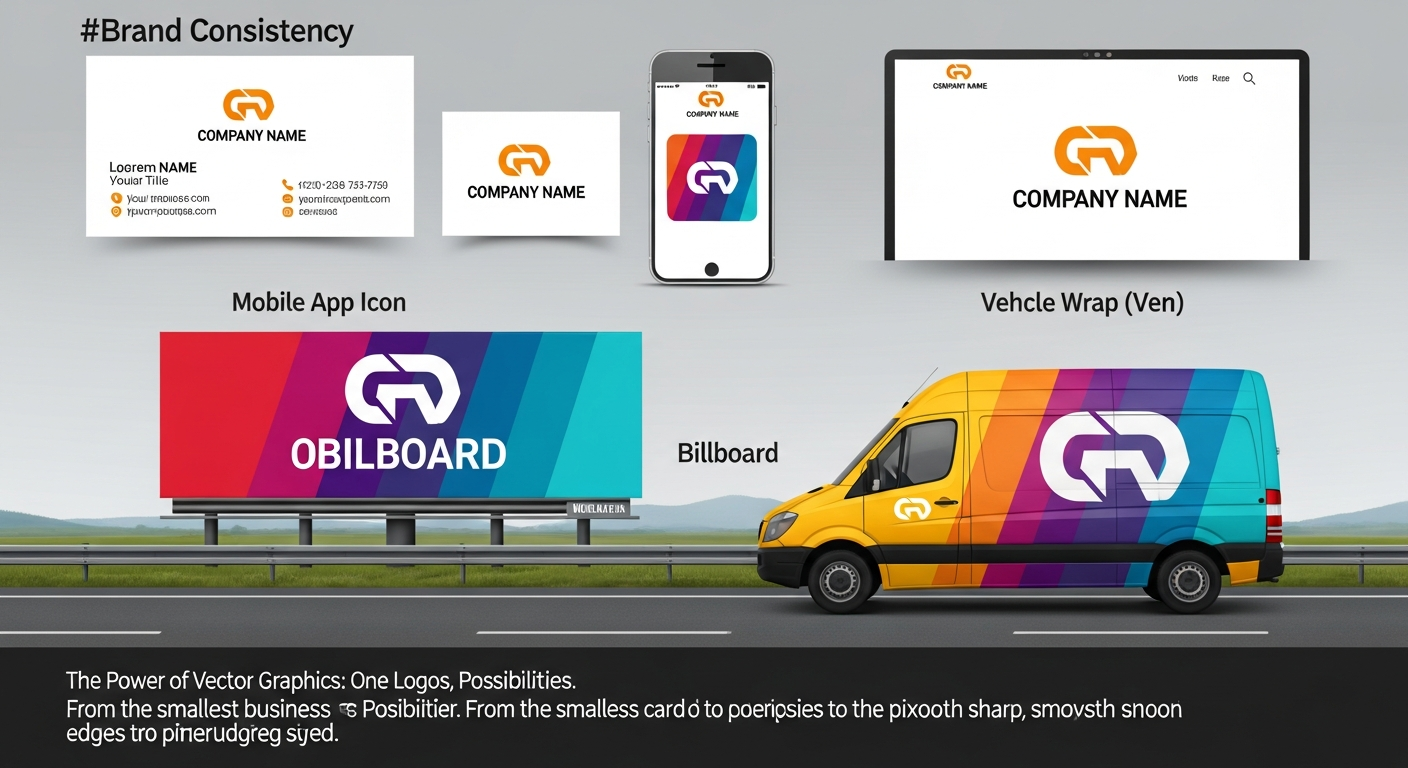
| Metric | Before SVG | After SVG | Impact | |--------|-----------|-----------|--------| | Asset variants per logo | 12-20 | 1 | -90% maintenance | | Design hours on resizing | 80-120/yr | 5-10/yr | -90% labor cost | | Brand consistency score | 65-75% | 95%+ | +30% perception | | File storage costs | Baseline | -60% | Direct savings |
Case Study — Small Business: A 15-person agency converted client brand kits to SVG-first. Result: 42% reduction in asset production time, zero client complaints about logo quality — down from 3-4 per quarter.
2. Interactive Data Visualization and Dashboards
Static chart screenshots become outdated instantly. SVG dashboards are lightweight, interactive, accessible, and update in real-time.
const bars = document.querySelectorAll('.chart-bar');
bars.forEach(bar => {
  bar.addEventListener('mouseenter', () => {
    bar.style.fill = '#1cb721';
    showTooltip(bar.dataset.label, bar.dataset.value);
  });
});
| Metric | Raster | SVG | Impact | |--------|--------|-----|--------| | Dashboard load | 3.2s | 1.1s | -65% load time | | Accessibility | Partial | Full WCAG 2.1 | Compliance | | Update workflow | Re-export | Data bind | -80% time |
3. Interactive Maps and Floor Plans
Retail, real estate, and hospitality need zoomable spatial tools. SVG maps zoom infinitely without pixelation — each region is clickable, styleable, and filterable.
| Metric | Raster | SVG | Impact | |--------|--------|-----|--------| | File size (typical) | 2-5 MB | 100-400 KB | -90% bandwidth | | Interactivity | None | Click, hover, filter | +45% engagement | | Maintenance | Full re-export | Edit XML | -70% update cost |
4. Design System Icons and UI Components
PNG icon libraries create maintenance nightmares. SVG icons inherit CSS colors via currentColor, scale from a single source, and are individually cacheable.
| Metric | PNG/Font | SVG System | Impact | |--------|----------|------------|--------| | Theme switching | Hours | Zero (CSS vars) | -95% effort | | New icon lead time | 2-4 hrs | 15-30 min | -85% faster |
5. Brand Animations and Micro-Interactions
Video animations weigh 5-20 MB. SVG animations deliver rich motion at 5-50 KB — resolution-independent and responsive to user interaction.
| Metric | Video/GIF | SVG Animation | Impact | |--------|----------|---------------|--------| | File size | 5-20 MB | 5-50 KB | -99% size | | Page speed impact | -30 pts | -1 pt | SEO preserved | | Time on page | Baseline | +40% | Engagement lift | | Bounce rate | Baseline | -15 to -25% | Retention gain |
Case Study — Mid-Market SaaS: A B2B platform replaced their 18 MB hero video with a 42 KB SVG animation. Lighthouse score jumped from 61 to 94, lead submissions increased 19%.
6. Professional Email Signatures
SVG signatures render sharp on every client at under 5 KB. For 500 employees, that is ~2 TB/year in bandwidth savings versus PNG signatures.
7. Presentations and Print Collateral
One SVG source exports perfectly to screen, print, and web — eliminating the multi-resolution export cycle entirely.
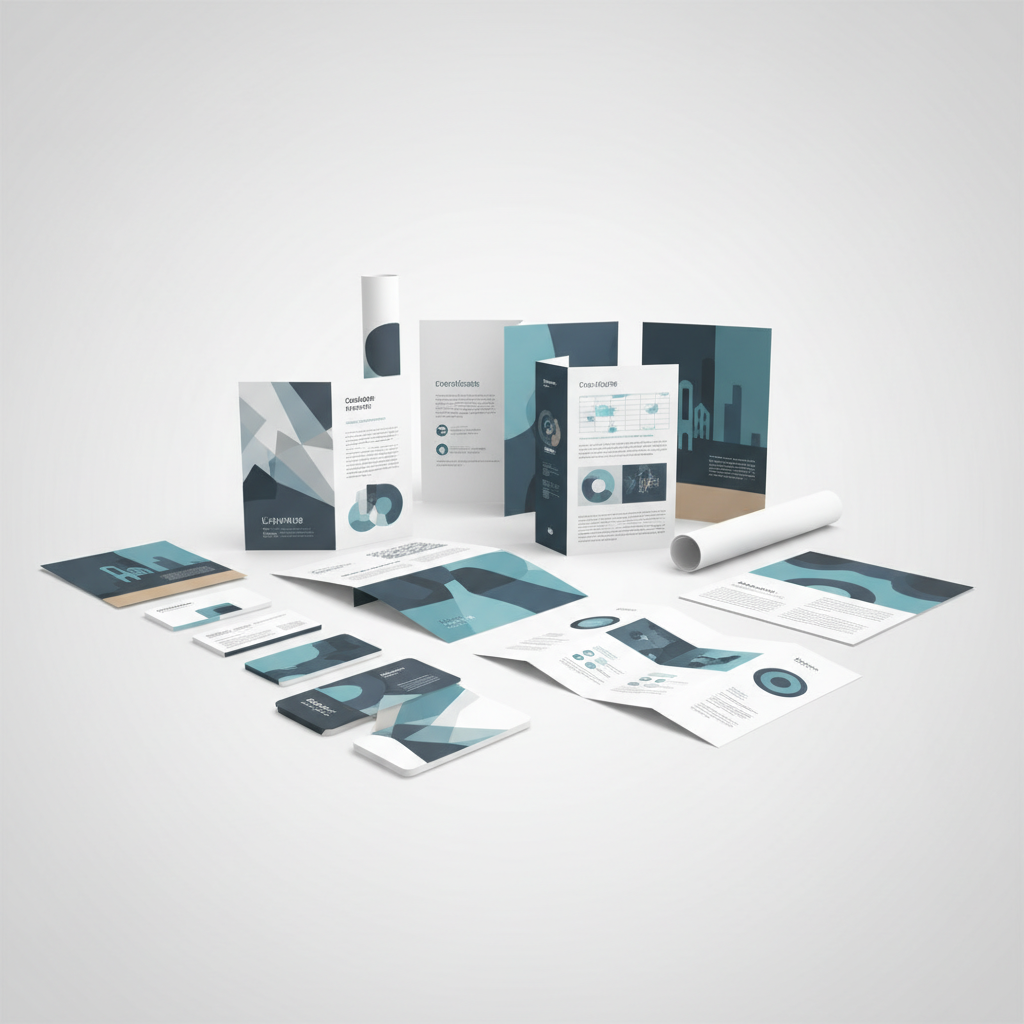
| Metric | Raster | SVG | Impact | |--------|--------|-----|--------| | Export variants | 3-5 per asset | 1 | -80% production | | Print quality issues | Frequent | Zero | Brand protection |
8. Prototyping and Design Handoff
SVG wireframes are code. Developers inspect, version-control, and implement directly — cutting revision cycles from 3-5 rounds to 1-2 with ~98% implementation accuracy versus ~85% with raster handoff.
9. E-Commerce Product Experiences
Raster product shots require dozens of variants and pixelate on pinch-to-zoom. SVG configurators, badges, and comparison charts deliver infinite-zoom clarity at a fraction of the bandwidth.
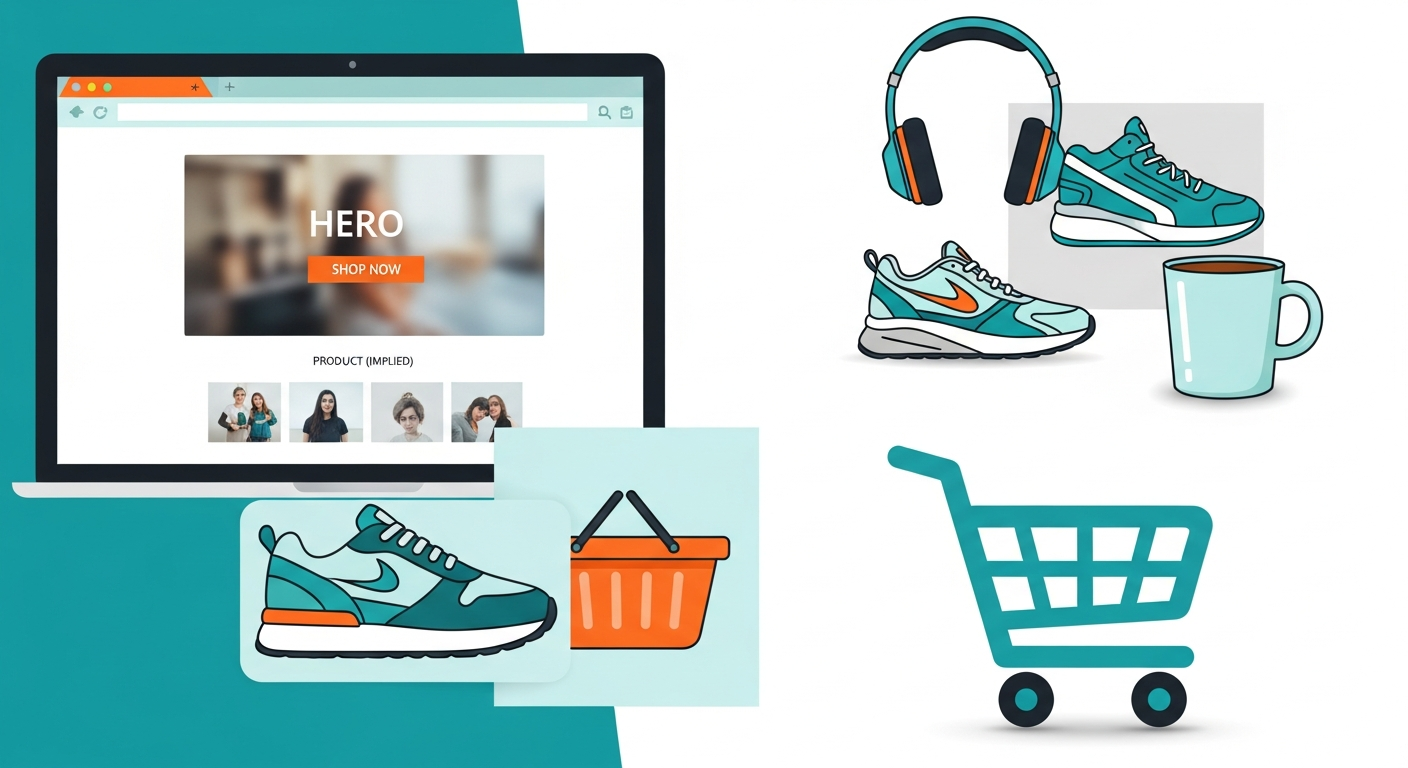
| Metric | Raster | SVG | Impact | |--------|--------|-----|--------| | Variants per product | 8-15 | 1-3 | -80% asset mgmt | | Mobile conversion | Baseline | +12-18% | Revenue lift |
Case Study — Enterprise: A Fortune 500 retailer migrated product badges and size charts to SVG. Result: $2.1M annual bandwidth savings, 22% faster page loads, measurable mobile conversion lift within 90 days.
10. Training and Technical Documentation
SVG diagrams are zoomable, searchable, accessible, and updatable via text edit. Update lead time drops from 2-5 days to 30 minutes; interactive annotations reduce onboarding time by 20%.
---
Cost Analysis: Raster vs. Vector (3-Year TCO)
| Category | Raster | SVG | Savings | |----------|--------|-----|---------| | Asset creation/resizing | $45,000 | $12,000 | $33,000 | | Bandwidth/CDN | $18,000 | $5,400 | $12,600 | | Design maintenance | $36,000 | $8,000 | $28,000 | | Cross-platform QA | $12,000 | $2,000 | $10,000 | | Total | $111,000 | $27,400 | $83,600 (75%) |
"SVG is not a design preference — it is a competitive advantage. Companies that treat visual assets as scalable, programmable infrastructure will outperform those trapped in the raster export cycle.
---
Department-by-Department Adoption Guide
Marketing
Quick wins: Logo conversion, social templates, email signatures, infographics. Use VectoSolve Batch to convert entire asset libraries in one pass. Timeline: 2-4 weeks.Engineering
Quick wins: Icon system migration, build pipeline optimization, design token integration. Use the VectoSolve Developer API for CI/CD pipelines. Timeline: 1-2 sprints.Product
Quick wins: In-app illustrations, onboarding flows, feature announcements, empty states. Timeline: Next design sprint.
---
Conclusion: SVG Is Infrastructure, Not Decoration
The businesses winning the next decade of digital experience treat visual assets like code — scalable, versionable, programmable. SVG is that foundation. These ten use cases generate measurable ROI at every company size. The question is not whether SVG makes sense — it is how quickly you can execute. Start your first conversion with VectoSolve today.